
The American Customer Satisfaction Index was developed at the University of Michigan by a prominent group of scientists under the leadership of Claes Fornell, the Distinguished Donald C. Cook Professor of Business (Emeritus). Dr. Fornell is a world-leading scholar in multivariate statistical models with latent variables and in customer satisfaction measurement and analysis. The group includes former University of Michigan faculty, Michael D. Johnson, now Professor and Marketing Department Chair, University of Wisconsin, and Gene Anderson, now Dean of the Pittsburgh School of Business. Important research contributions were also provided by David F. Larcker, the James Irvin Miller Professor of Accounting at Stanford University, and former University of Michigan faculty, Birger Wernerfelt, now the JC Penney Professor of Management at MIT. Due to the commercial applicability of ACSI, the University of Michigan’s Technology Transfer Unit later shifted its ownership to its developer, Dr. Fornell.
The American Customer Satisfaction Index (ACSI): Quarter 1, 2025
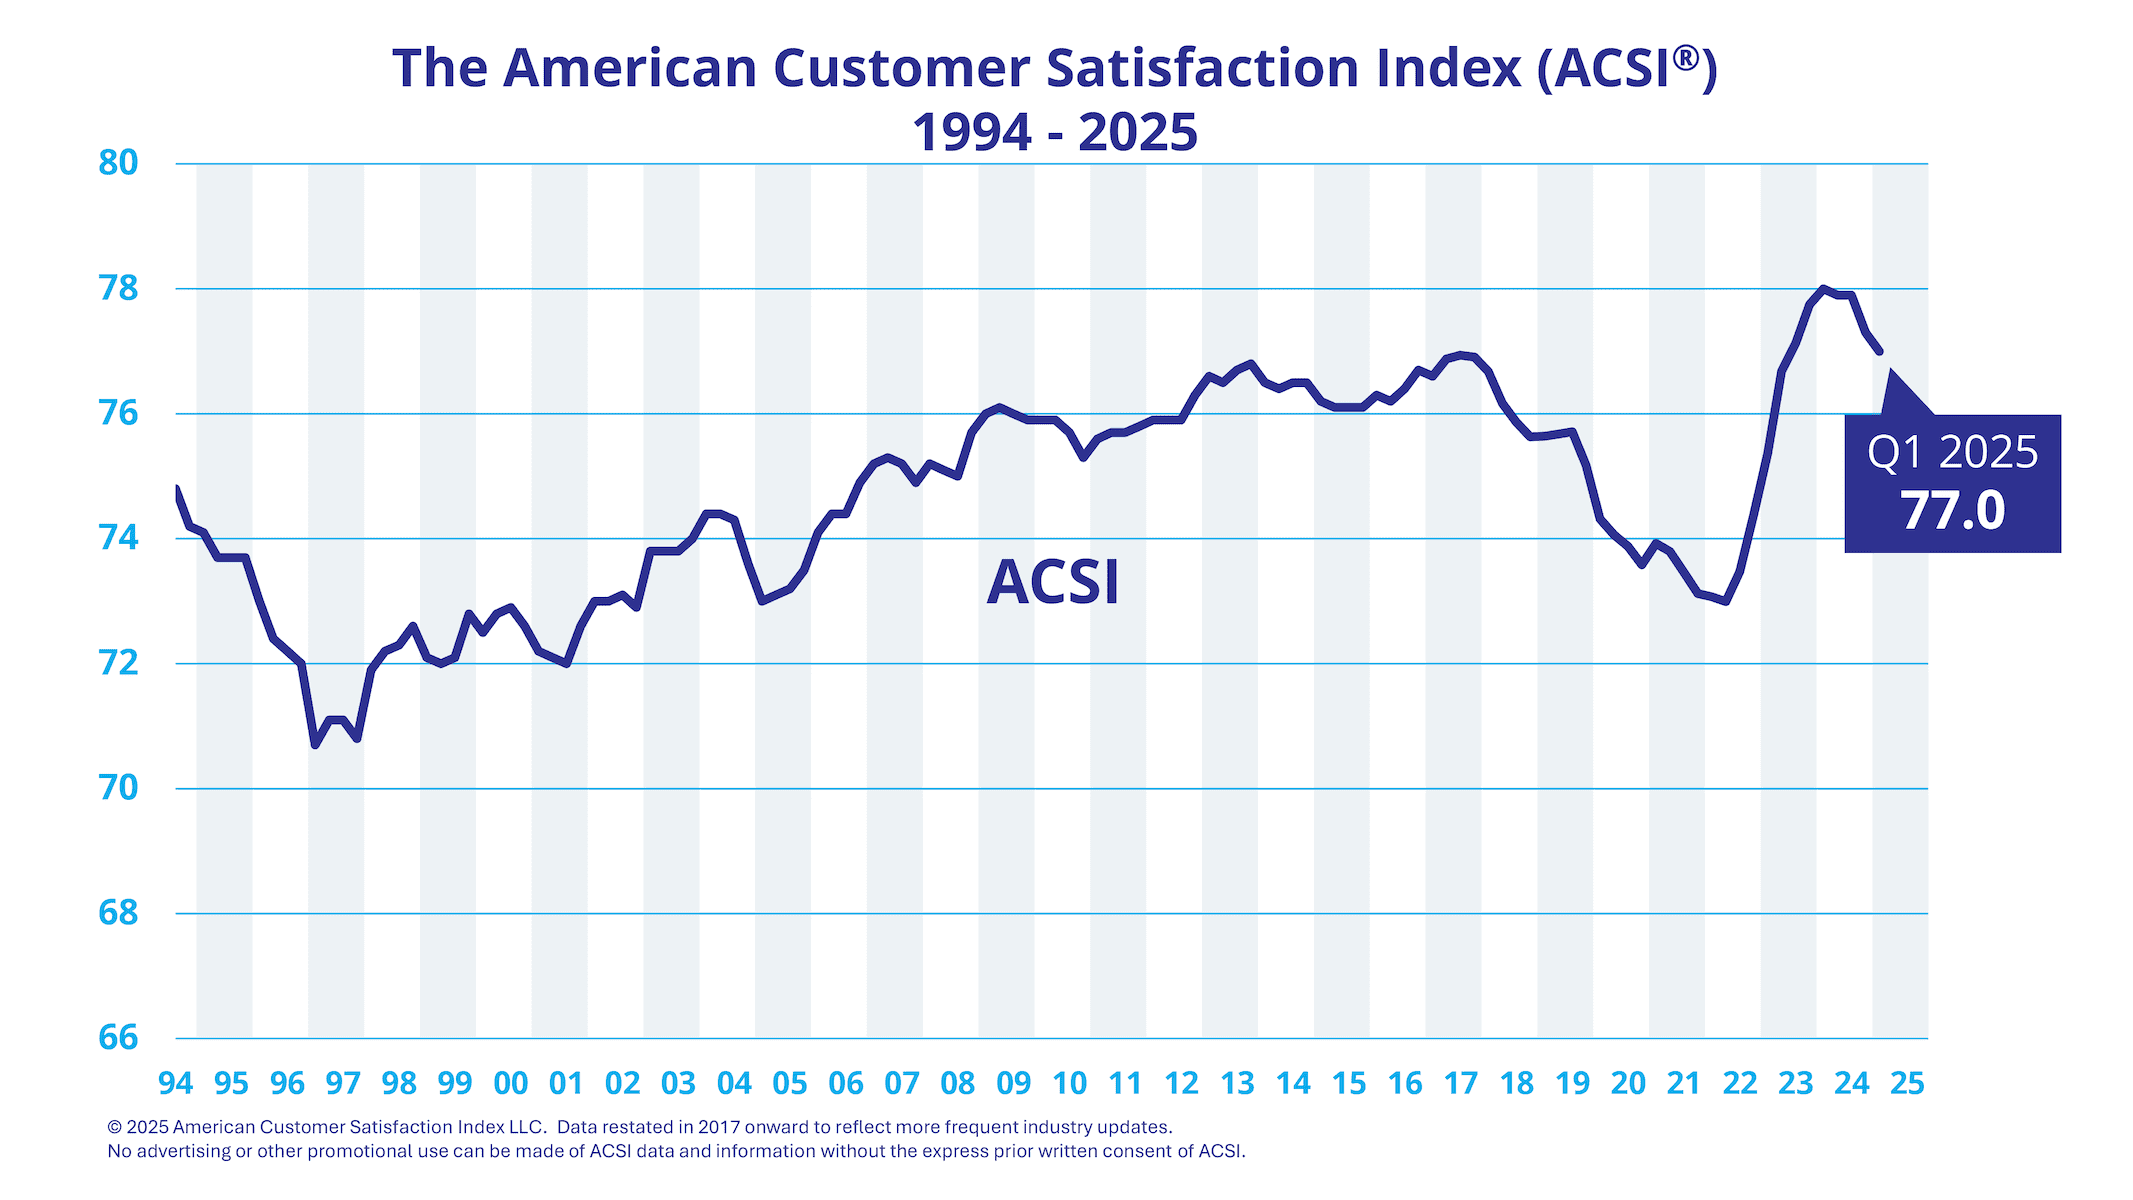
U.S. CUSTOMER SATISFACTION FALLS
As GDP contracted and consumer sentiment fell, the American Customer Satisfaction Index (ACSI®) also declined in the first quarter of 2025. The Index has now remained flat or dropped in four consecutive quarters; something that hasn’t occurred since the COVID-19 crisis. It is down by 0.4% in the first quarter of 2025 and by 1.3% for the past year to 77.0, led by slumps for the U.S. Postal Service, cell phones, and apparel.
ACSI measures quality of economic output (relative to price). GDP tracks quantity of economic output. These two statistics often move together, but not always. This time, both are negative, but their current relationship is spurious. GDP contracted due to a major surge in imports from inventory stockpiling, triggered by a threat of higher tariffs. Customer satisfaction is of no relevance in that context but has declined due to price increases and inconsistent service quality.
Weakening customer satisfaction has a negative effect on demand. Strengthening the buyer-seller relationship is important because it leads to exponentially increasing profits — especially at high levels of customer retention — and much improved cash flow stability. This is especially relevant in industries where customer satisfaction elasticity of demand is high, such as subscription TV, credit unions, internet service providers, banks, wireless phone services, and financial advisors, but less so for supermarkets, gas stations, and social media. The U.S. Postal Service, cell phones, apparel, and online investment companies are among those that declined the most in customer satisfaction over the past year and also most at risk for revenue growth uncertainty.
The general lack of strong business-customer relationships in the United States is problematic. Customer satisfaction has not improved substantially over the past 12 years, despite vast corporate investments to do just that. Extrapolating the ACSI trajectory from the first decade of this century, customer satisfaction would be almost 6% higher than it is today and there would be much higher customer loyalty to boot. There is no evidence that inflated consumer expectations are to blame: The expectations-satisfaction gap has remained fairly constant over time. The problem lies in poor performance metrics and data analytics. The metrics generally fail in separating data noise from information. The data analytics are ill-suited for the many idiosyncrasies in customer data, making resource allocation for improving customer relationships more difficult. While analytical rigor and science-based measurement instruments are often absent, they are necessary for realizing the financial benefits from strong customer relationships: high returns/low risk.
| 1st Quarter | 2nd Quarter | 3rd Quarter | 4th Quarter | |
|---|---|---|---|---|
| 2025 | 77.0 | |||
| 2024 | 78.0 | 77.9 | 77.9 | 77.3 |
| 2023 | 75.4 | 76.7 | 77.1 | 77.8 |
| 2022 | 73.1 | 73.0 | 73.5 | 74.4 |
| 2021 | 73.9 | 73.8 | 73.5 | 73.1 |
| 2020 | 74.3 | 74.1 | 73.9 | 73.6 |
| 2019 | 75.6 | 75.7 | 75.7 | 75.2 |
| 2018 | 76.7 | 76.2 | 75.9 | 75.6 |
| 2017 | 76.6 | 76.9 | 76.9 | 76.9 |
| 2016 | 76.3 | 76.2 | 76.4 | 76.7 |
| 2015 | 76.2 | 76.1 | 76.1 | 76.1 |
| 2014 | 76.5 | 76.4 | 76.5 | 76.5 |
| 2013 | 76.6 | 76.5 | 76.7 | 76.8 |
| 2012 | 75.9 | 75.9 | 75.9 | 76.3 |
| 2011 | 75.6 | 75.7 | 75.7 | 75.8 |
| 2010 | 75.9 | 75.9 | 75.7 | 75.3 |
| 2009 | 76.0 | 76.1 | 76.0 | 75.9 |
| 2008 | 75.2 | 75.1 | 75.0 | 75.7 |
| 2007 | 75.2 | 75.3 | 75.2 | 74.9 |
| 2006 | 74.1 | 74.4 | 74.4 | 74.9 |
| 2005 | 73.0 | 73.1 | 73.2 | 73.5 |
| 2004 | 74.4 | 74.4 | 74.3 | 73.6 |
| 2003 | 73.8 | 73.8 | 73.8 | 74.0 |
| 2002 | 73.0 | 73.0 | 73.1 | 72.9 |
| 2001 | 72.2 | 72.1 | 72.0 | 72.6 |
| 2000 | 72.5 | 72.8 | 72.9 | 72.6 |
| 1999 | 72.1 | 72.0 | 72.1 | 72.8 |
| 1998 | 71.9 | 72.2 | 72.3 | 72.6 |
| 1997 | 70.7 | 71.1 | 71.1 | 70.8 |
| 1996 | 73.0 | 72.4 | 72.2 | 72.0 |
| 1995 | 74.1 | 73.7 | 73.7 | 73.7 |
| 1994 | – | – | 74.8* | 74.2 |
*Baseline measurement taken in summer 1994
While companies today have more data about their customers, the analytics employed to turn data into information are for the most part not good enough. Customer satisfaction data have certain characteristics that make it difficult to obtain accurate estimates, to pinpoint what aspects of the customer experience need attention, and to gauge the financial impact of actions contemplated. Traditional statistical methods assume normal frequency distributions among the residuals, moderate multicollinearity, and low levels of data noise. Customer satisfaction data don’t meet these assumptions.
ACSI Analytics is designed to overcome these problems and thereby turning raw data into financially relevant information by:
- Separating signals from noise
- Moving from correlations and artificial intelligence (AI) patterns to cause-and-effect interpretations
- Calibrating measurement instruments toward profitability
Data is not the same as information—especially not data from consumer surveys. Management decisions require information; raw data must be filtered in order to be useful for decision-making. ACSI technology filters out data noise.
Management decisions require cause-and-effect information—something that current CX tools, whether based on AI or descriptive statistics, don’t provide. ACSI Analytics, on the other hand, is based on a causal model.
There is a wide disparity in the amount of consumer data collected by companies today. Some data suppliers use surveys with more than 200 questions per respondent, while others focus on responses to a single question. Neither is appropriate. Excessively long surveys may lead to straight-line responses. Good measurement techniques—whether in the social or physical sciences—typically require several measures (survey questions in this case) per product feature or service dimension.
Accuracy and relevance are what matters. To contribute to the business objectives at hand, the measurement instruments need calibration in ways similar to the physical sciences. This is why companies with high scores in the American Customer Satisfaction Index, which is calibrated to maximize customer loyalty, are financially successful, most notably in terms of stock returns and profitability.
No advertising or other promotional use can be made of ACSI data and information without the express prior written consent of ACSI LLC.